Execution is observable. So is whether anyone cared.
Read a sector the way an analyst would: what each company shipped, what the market actually did in response, and which moves went out to silence. Deterministic, cited, and read-only by architecture.
Shipping cadence is table stakes. Reception is the differentiator.
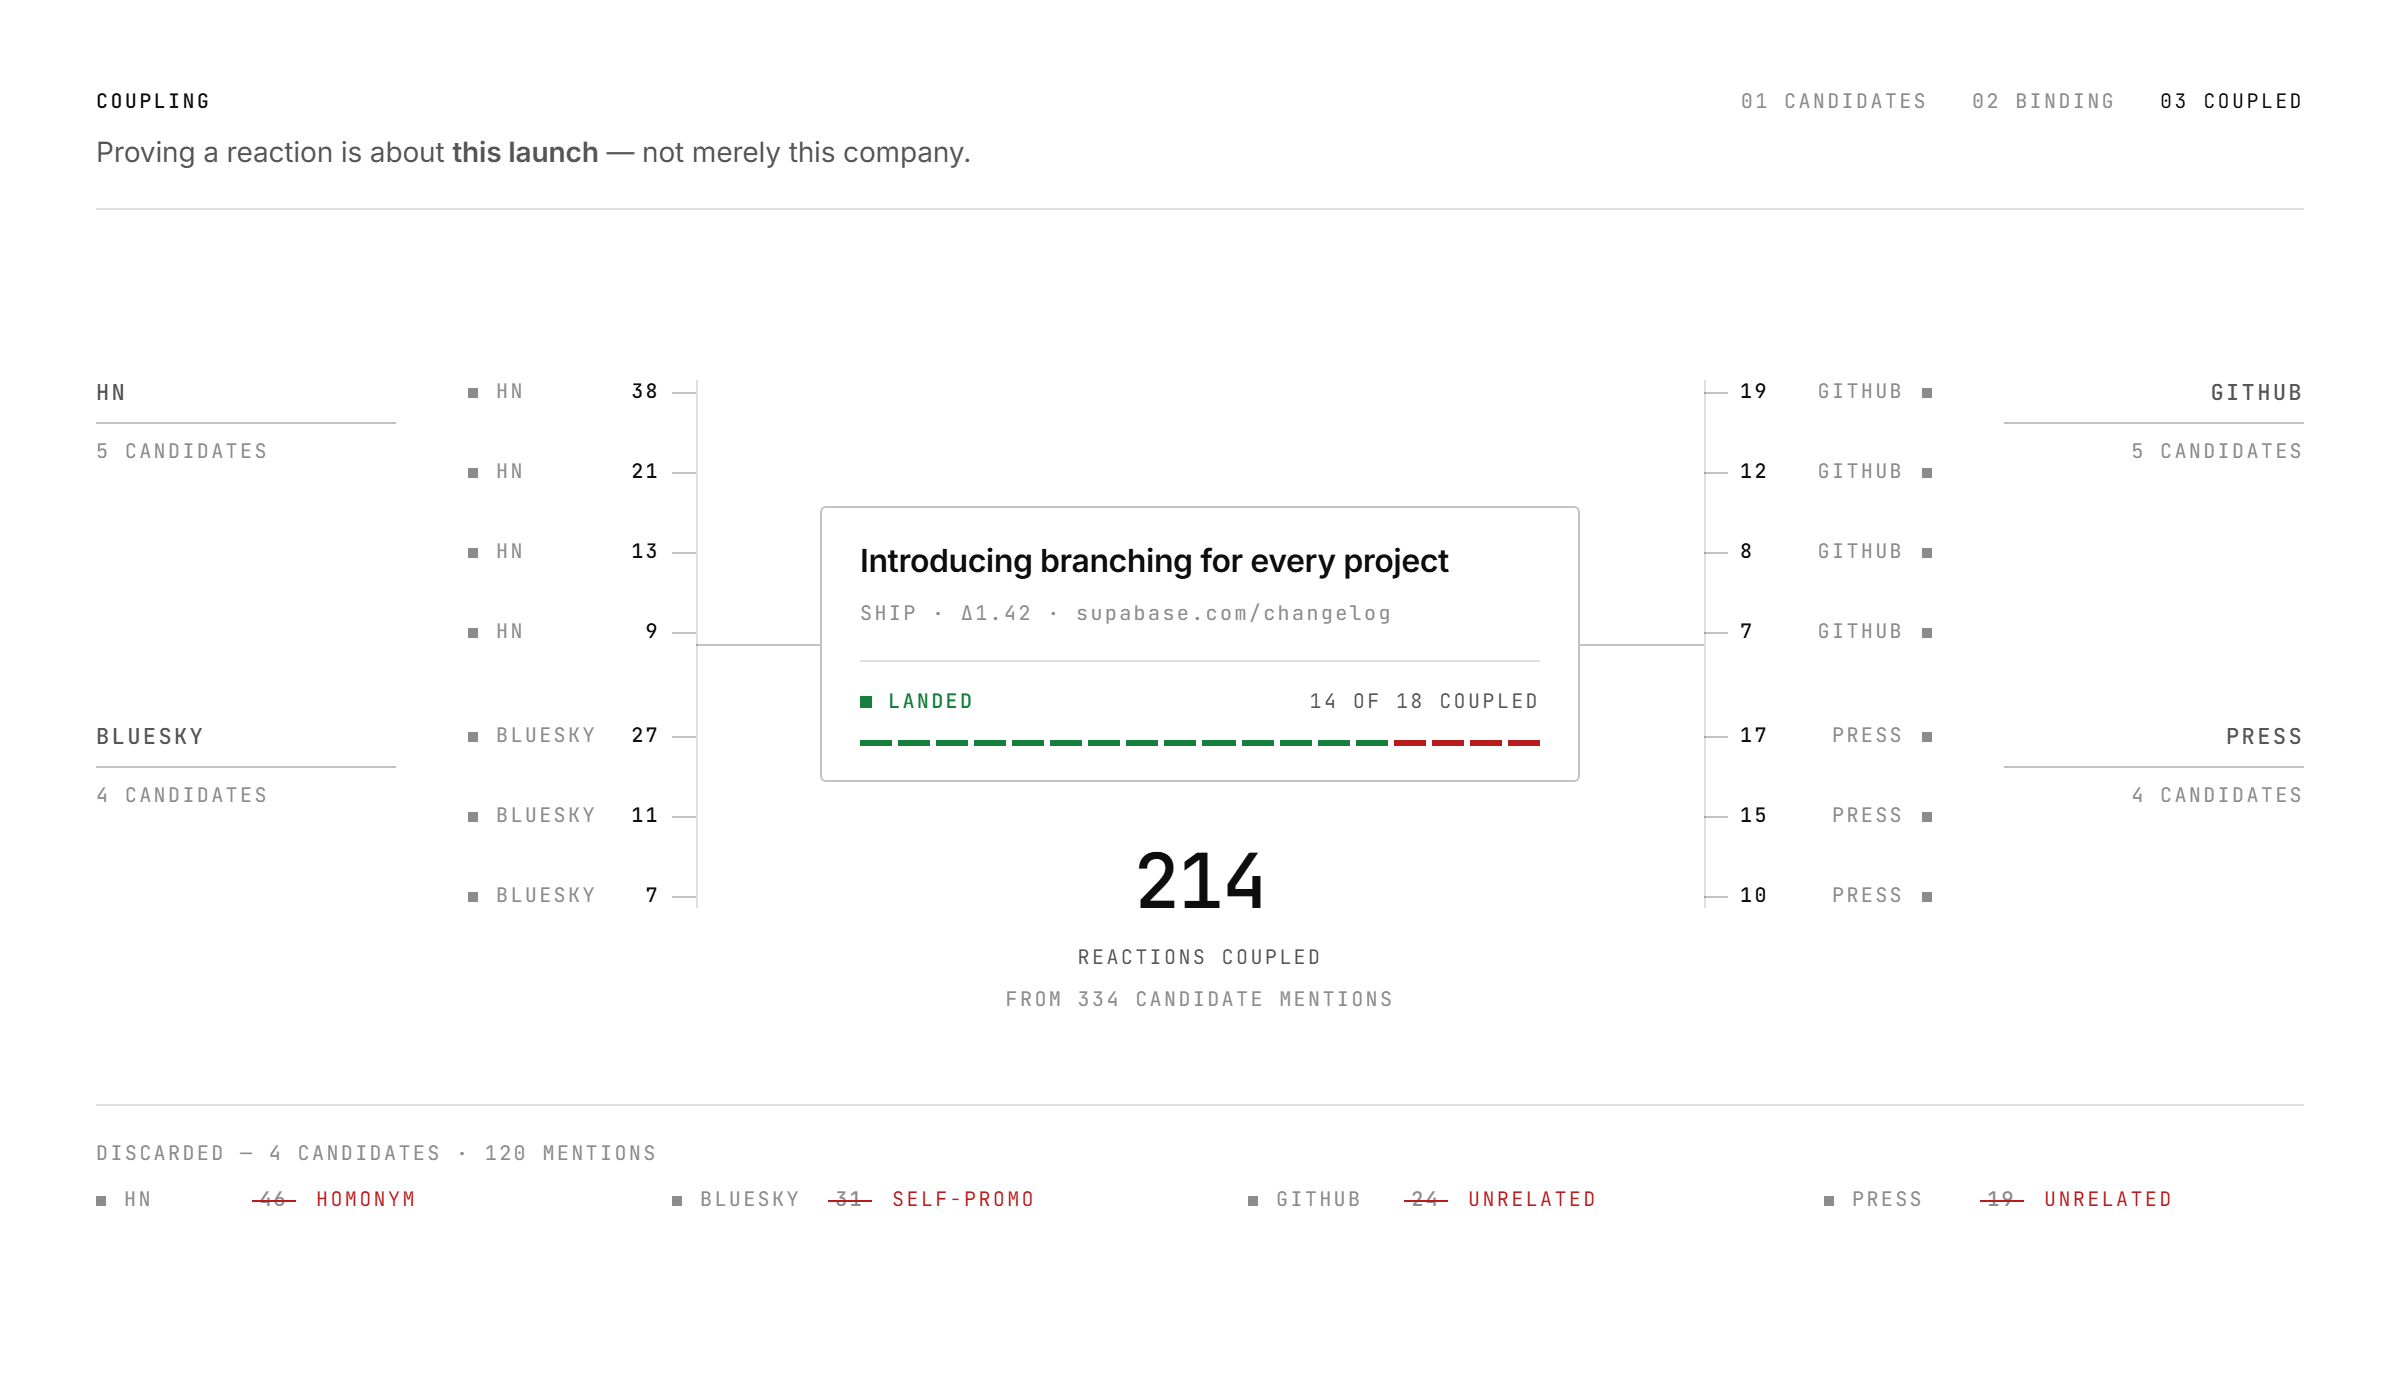
Any tool can count releases. Counting them tells you a team is busy, not that a market wants what they're building. Of 2,365 scored moves across published sectors, 286 earned a measurable public reaction — roughly 12%. The distribution of that gap across a sector is the read.
A whole sector, on one page.
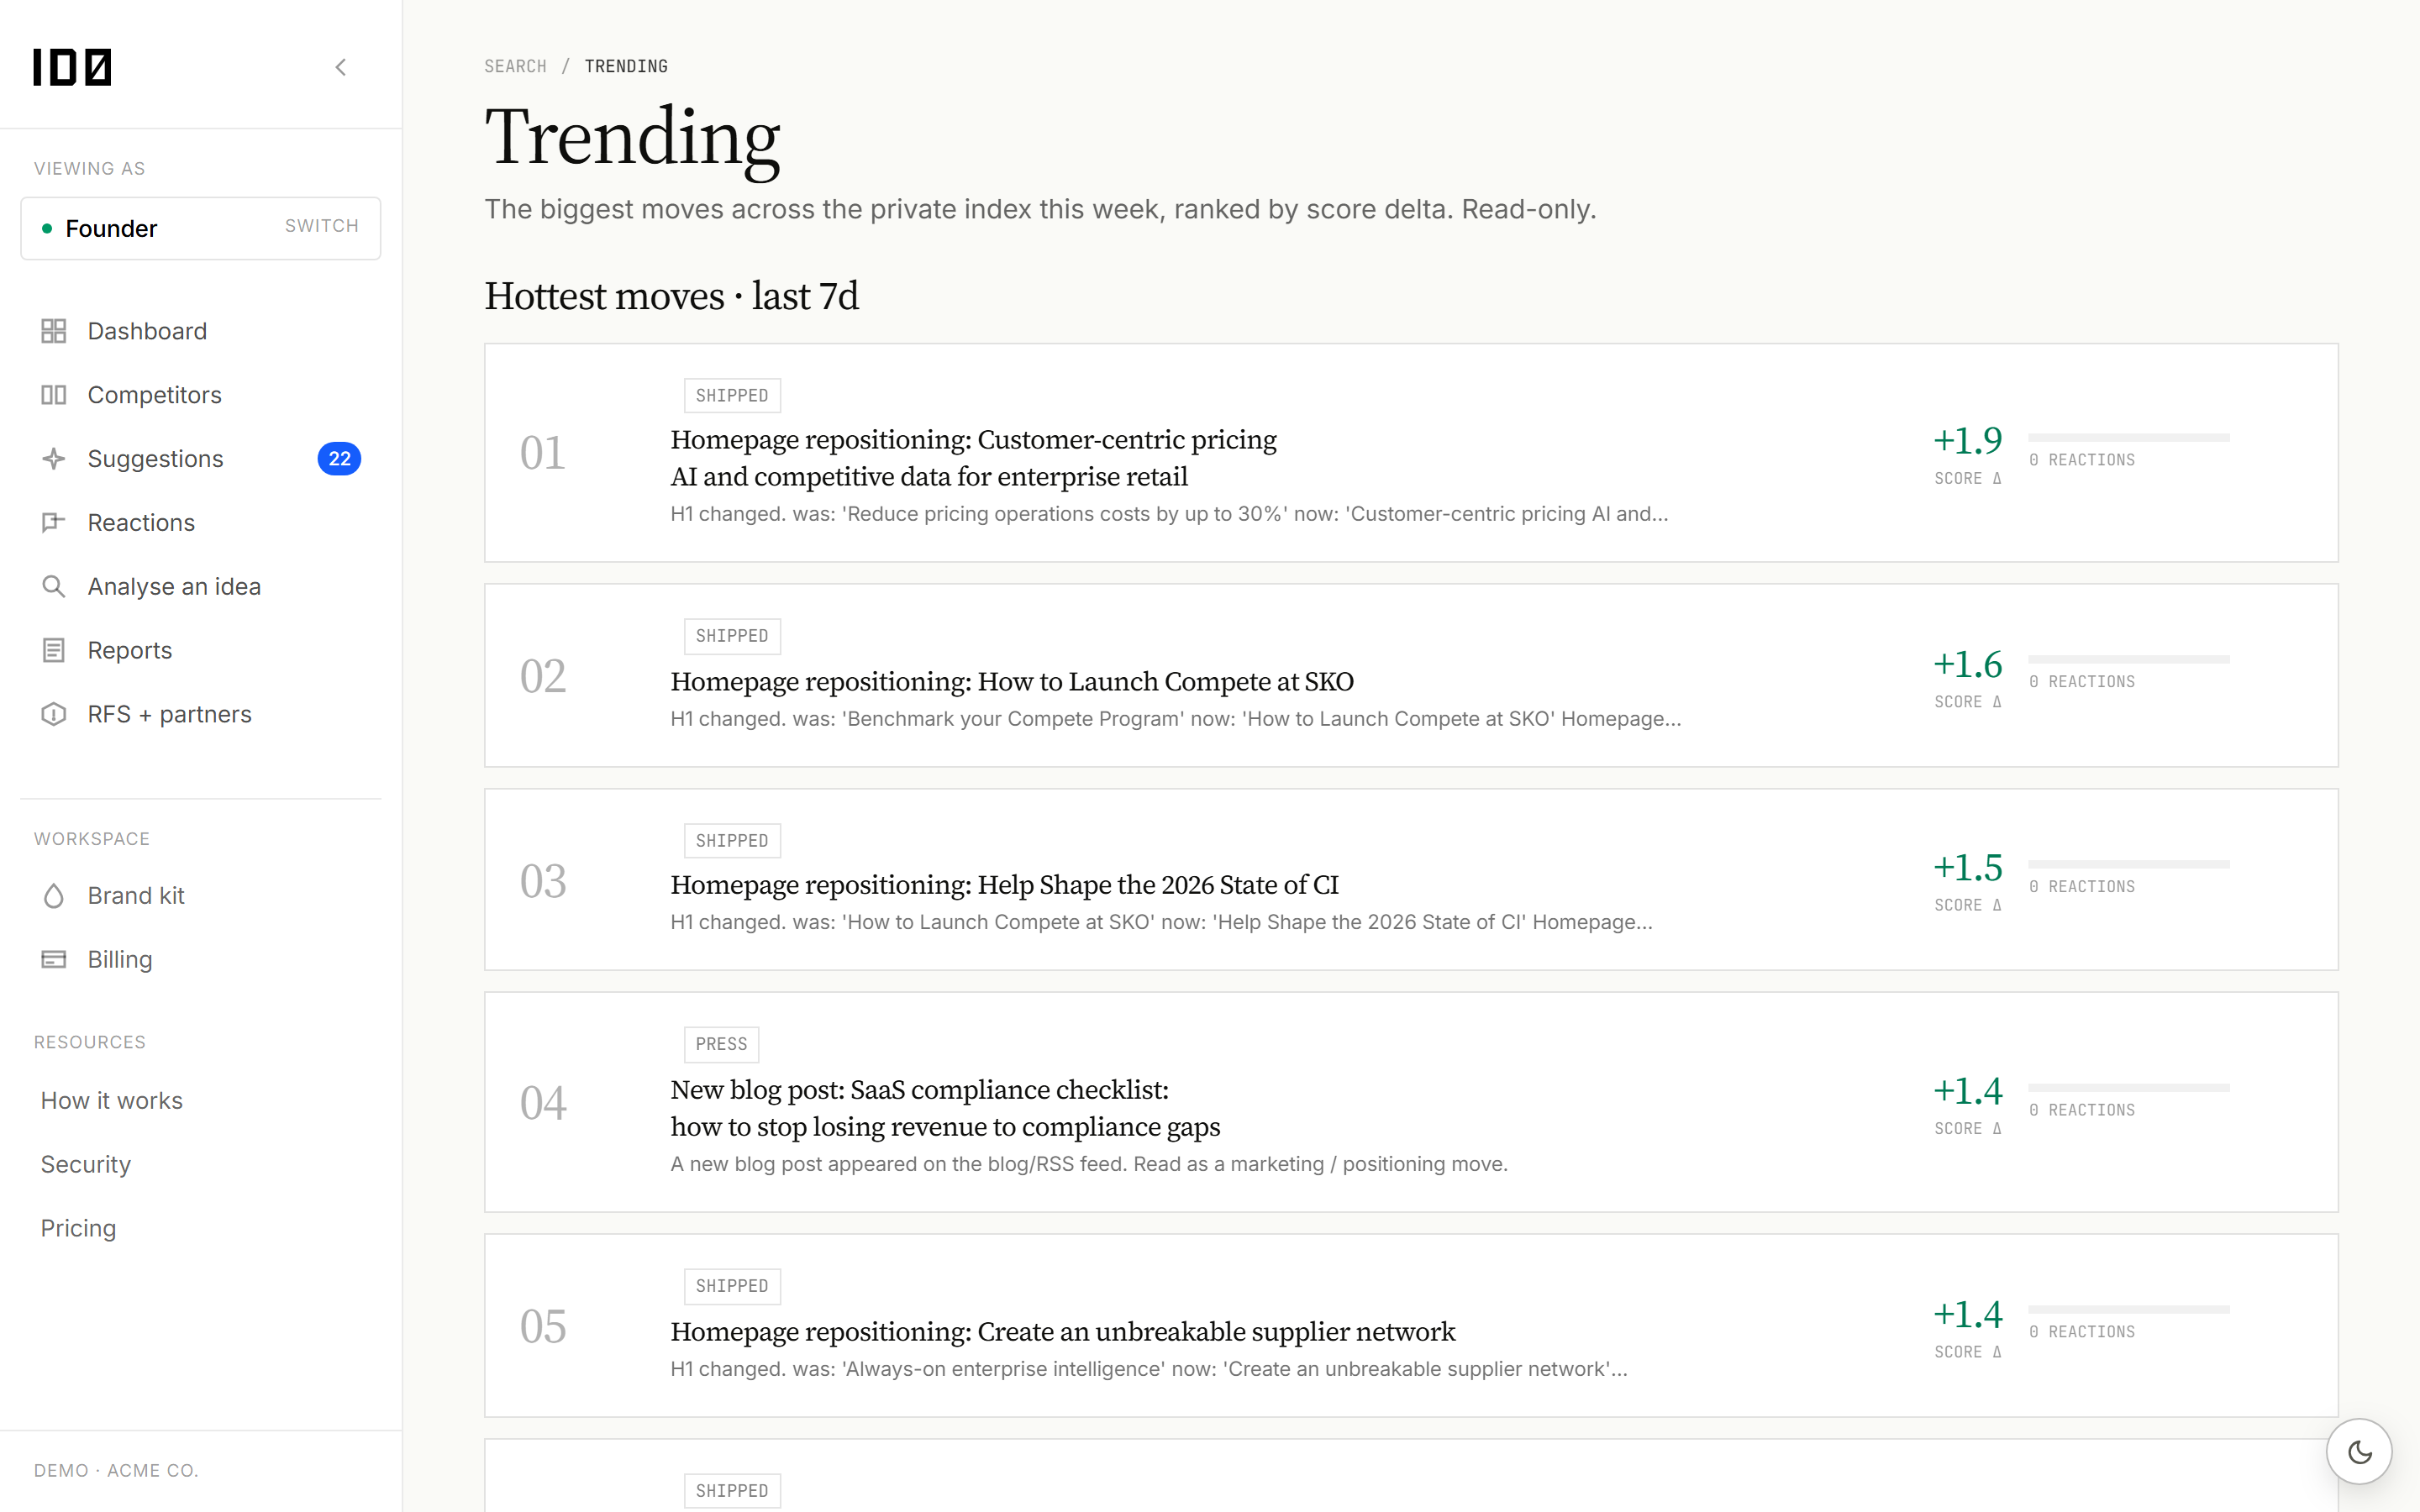
Which companies ship and land, which ship to silence, where a market is running hot and where it's gone quiet. Every line drills to the source it was read from, so nothing has to be taken on trust.
Exactly what we've run — nothing implied.
This is the whole list, generated from the published reports themselves. Sectors are added because someone asked for them, not to make a coverage slide look fuller.
Developer Tools
574 moves · 268 reactions · 59 landed · July 2026
B2B Fintech
546 moves · 59 reactions · 23 landed · July 2026
AI Infrastructure
340 moves · 198 reactions · 70 landed · July 2026
Data & Analytics
216 moves · 49 reactions · 24 landed · July 2026
Design & Collaboration
193 moves · 80 reactions · 25 landed · July 2026
Cloud Security
164 moves · 149 reactions · 26 landed · July 2026
AI Coding Tools
122 moves · 105 reactions · 29 landed · July 2026
Creator & Publishing
108 moves · 90 reactions · 12 landed · July 2026
DevOps & Observability
102 moves · 49 reactions · 18 landed · July 2026
What this is not.
Worth being blunt about, because several of these are things the category routinely implies it does.
Not a database
We don't claim an index of every private company. We publish sectors we've actually run the engine across, and you can read every one of them.
Not a signal feed
Volume is the easy part. The output is ranked by what the market measurably reacted to, so a quiet week reads as a quiet week.
Not a model's opinion
No language model produces a score. It comes from the diff between observations and the counted reaction, so two people re-running it get the same number.
Not visible to founders
No company is notified, followed, or told anyone looked. There is no mechanism in the product to do it.